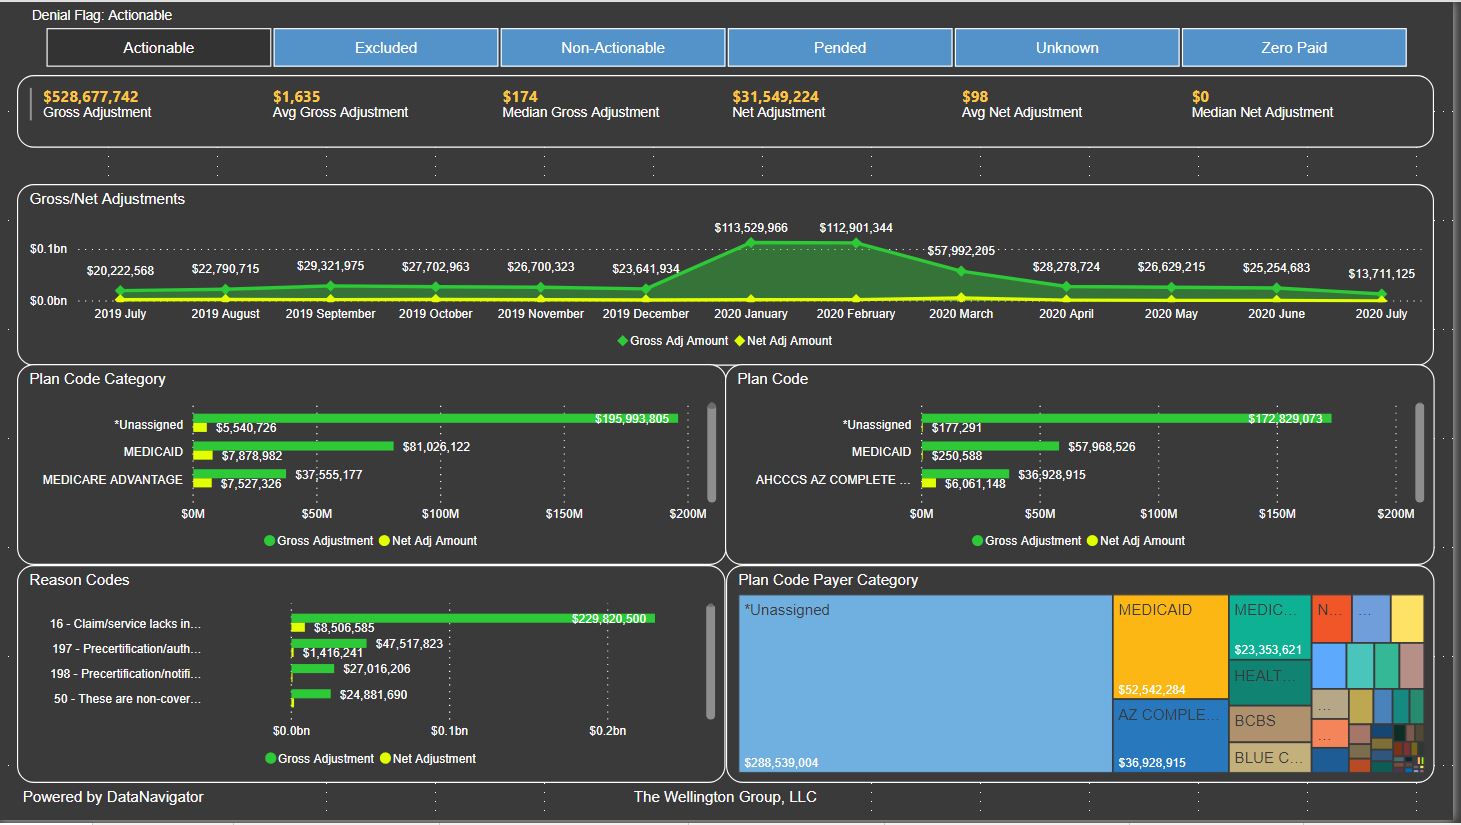
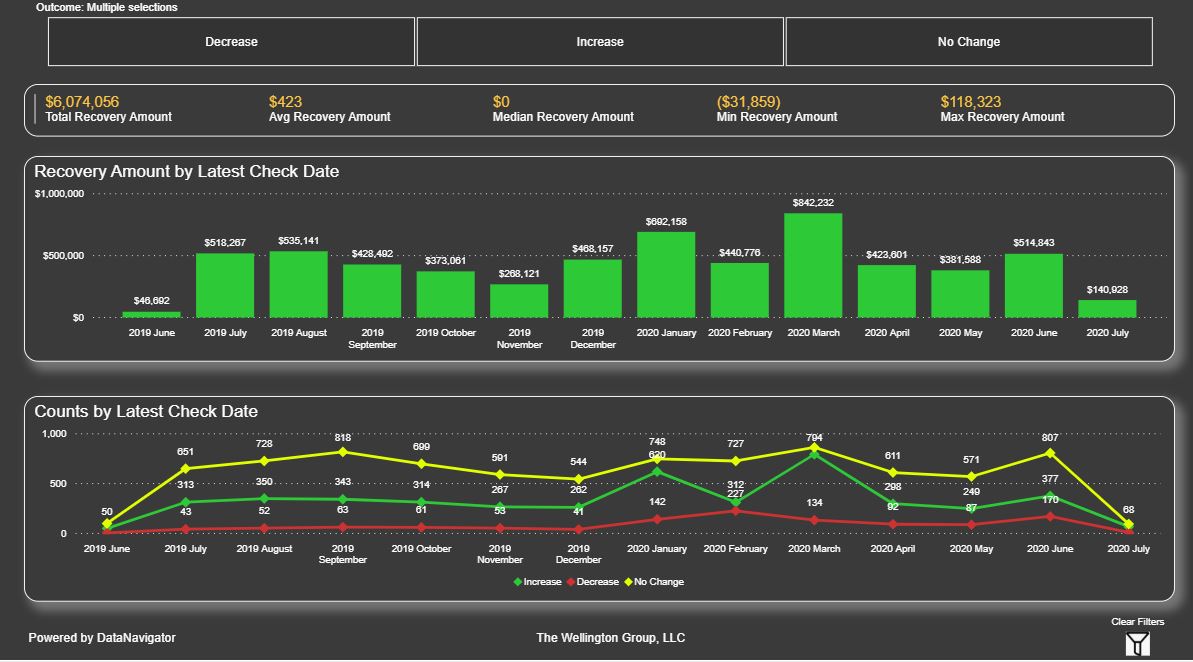
DataNavigator is a comprehensive and interactive business intelligence (BI) platform designed to assist multiple departments in the revenue cycle to develop keen insights into their data to make faster and better decisions. Departments benefitting from this tool are:
- Revenue Cycle- Identify and monitor at the line-level combinations of root-causes, departments, physicians, medical coder, payers and others involved in both denials and audits.
- Health Information Management (CDM)- Identify the frequency and dollars associated with coding mismatches amongst multiple code sets (DRG, procedure, HCPCs, diagnosis, etc.).
- Compliance- Identify potential exposure to targeted external audits- i.e. If payers initiate audits based upon certain scenarios you’ll be able to identify potential financial exposure.
- Payer Contracting- Identify the specific payer types. For example, your able to identify certain issues that are associated with Humana, but by interacting with the data and drilling-down further your able to identify that Humana Gold is the actual offending payer.
Wellington imports claims (837), remits (835), audit issues, denial issues, accounting files (e.g. expected payments), medical coder information, and much more into our data warehouse. DataNavigator’s primary asset is the underlying data warehouse which drives the use of business intelligence tools that are built on Microsoft’s Power BI toolset rated by the Gartner Group as the best in class. ‘best in class’. As a result, this allows end-users and individual departments to customize and prioritize data fields to allow them to interact and drill-down to the next inquiry with the objective of seeking root-causes to further assist the improvement process. This granular data can then be shared with clinical and operational staff to provide results at both the departmental and line-levels.
Traditional reporting stops at the data contained in the report where DataNavigator's business intelligence environment allows the user to ask and research the next inquiry to further move to a granular level that assists in the improvement process.
Short Feature List
- KPI’s
- Payer Dashboards
- Root Cause Analysis
- Denial Code Level Reporting (CARC and RARC)
- Rules based Denial Code Assignment of Actionable, Departmental and Root Cause
- Collect, sort, and organize the data at the line-level so you can drill-down and interact with the data to pinpoint root-causes for both denials and audits.
-
Detail Analysis Levels Including:
- Net and Gross Charges
- Attending/Rendering/Operating Physicians
- Revenue Code/CPT/HCPCS/Modifiers
- Payer and Insurance
- Patient Type
Denial Trending
 Denial Recovery Trending
